 The fuel cell polarization curve provides useful information on fuel cell performance, however; additional information is needed to study its performance characteristics accurately. Cell resistance provides insightful information about a fuel cell that is not completely captured by polarization curves. Since fuel cell current densities are high in comparison with other electrochemical processes, small amounts of ohmic resistance (milliohms) have a significant effect on overall efficiency.
One of the greatest sources of resistance in a fuel cell is the electrolyte. A characteristic of the electrolyte is to allow the passage of ions; however, this presents greater resistance than the electrically conductive GDL and flow field plates. This electrolyte resistance is called ‘ohmic polarization,’ and it’s an important metric for fuel cell performance because it quantifies internal cell losses. The electrolyte resistance should be monitored during stack development and manufacture because ohmic losses generate heat that must be removed from the fuel cell. Electrolyte resistivity is a function of operating conditions; therefore, it’s important that the resistance is determined while the cell is operating.
The electrode / solid electrolyte interface has a large capacitance associated with it that allows an AC measurement to be used to determine an electrolyte resistance separate from the polarization resistance. The methods typically used for electrolyte resistance measurement are the Current Interrupt (iR), AC resistance, High-Frequency Resistance (HFR), and Electrochemical Impedance Spectroscopy (EIS).
One method of measuring resistance in a fuel cell is to interrupt the current for a very short interval (a few milliseconds) and record the resulting voltage. The difference between the cell voltage before and after the current interrupt, divided by the current, is the cell resistance. The voltage behavior may be monitored in real time using an oscilloscope, or several discrete voltage readings may be done at different interrupt times. This method can be utilized with simple measurement devices and can be implemented on high-power fuel cell systems.
The AC Resistance method applies a fixed, single high-frequency sine wave (typically 1 kHz) to the fuel cell to measure the total impedance of the cell at that frequency. The electrolyte ohmic resistance is calculated after correcting for the impedance of the load, which is in parallel with the fuel cell.
Similar to the current interrupt method, this method only provides a single data point. An advantage of the method is that the cell is minimally disturbed while this test is being conducted. An accurate gain-phase characterization of the impedance at operating conditions is required to obtain accurate results. The actual cell impedance can be separated using a measured load impedance, along with the magnitude and phase data of the milli-ohm meter, to calculate the impedance of the cell.
In the HFR method, the electrolyte resistance is determined by applying a small AC signal to the electronic load to modulate the DC load current. The magnitude and the phase of the AC voltage and current response are measured by a frequency response analyzer. A high, single frequency such as 1 kHz is used. The component of interest is the real (Z) component displayed in milliohms.
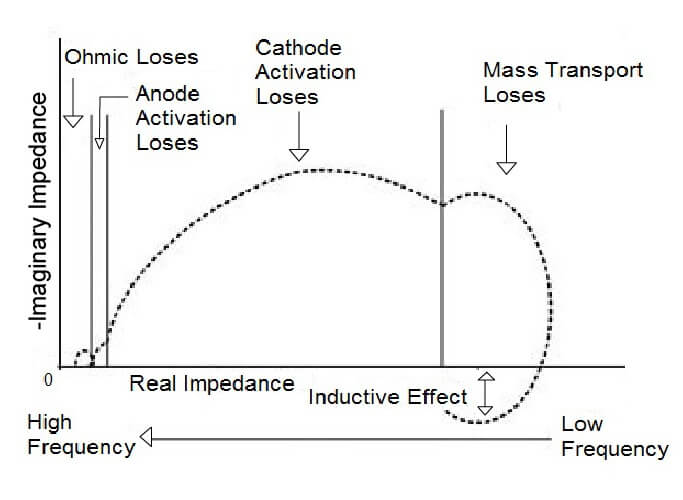
The HFR measurement minimally disturbs the cell; therefore, it is suitable for testing during routine fuel cell operation. The measurement frequency can vary with fuel cell type and must be carefully selected. The selection of the proper frequency is accomplished by comparing the phase difference between the applied current and measured voltage. If the difference is zero, the cell is functioning in a resistive manner. This frequency should be where the imaginary component of the impedance is zero (Z” = 0). In the Nyquist plot, this occurs where the impedance data crosses the real axis at high frequency (small Z’). If the plot does not cross the actual axis at high frequency, the highest frequency before the plot deviates from the semicircle shape can be used.
Electrochemical impedance spectroscopy (EIS) is a powerful technique that can be used in-situ to characterize the impedances in a fuel cell stack. AC impedance measurements can be helpful in identifying the kinetic, ohmic, electrolytic, and diffusion layer resistances, as well as the transport limitations in the system. This method uses a small sinusoidal perturbation potential at one or several frequencies, and the response is an alternating current (AC) signal of the same frequency with a possible phase shift and amplitude change. In some measurement systems, the AC current is imposed on top of the DC current generated by the fuel cell, and the voltage is recorded instead of the current. The recorded response is used to calculate the impedance using a mathematical technique. By repeating this at several frequencies, an electrochemical impedance spectrum is obtained.
EIS is a noninvasive technique that varies the current or voltage of the fuel cell by a few percent. The magnitude of the fluctuations is dependent on the peak-peak current of the AC signal imposed and the impedance of the fuel cell at each frequency. The AC-Impedance measurement is obtained with an electronic load, a function generator, and a computer. This is also the same setup can also be used for obtaining a fuel cell polarization or IC curves.
EIS is useful in characterizing fast and slow transport phenomena because it tests both a single and a large range of frequencies. This test helps to characterize mass transfer resistance, resistance to electron transfer during electrochemical reactions, and ionic resistance through the membrane. This data can then be used to characterize the various impedances inside the fuel cell.
The EIS technique is an extension of the HFR technique but differs in two ways. The HFR method uses a single frequency and only examines the real component of the impedance. EIS measures a broad range of frequencies and monitors the resulting variations in magnitude and phase of the cell voltage and current with a frequency response analyzer to determine the complex impedance (Z’ and Z”) of the fuel cell. Performing the test is straightforward except for selecting the function generator frequency. Electrochemical impedance spectroscopy is the most widely used technique for distinguishing fuel cell losses.
Examining the resistance in the fuel cell stack is an efficient method of determining where fuel cell stack performance losses are occurring. In simple fuel cell stacks, resistance can be caused by several factors including materials of construction, clamping pressure, and the electrolyte thickness. The techniques described in this post aid in determining fuel cell resistance and specifically electrolyte resistance. One or more of these methods (Current Interrupt (iR) method, AC resistance, High-Frequency Resistance (HFR) and Electrochemical Impedance Spectroscopy (EIS) can be used to understand and troubleshoot resistance losses that affect fuel cell performance.
 Posted by
Dr. Colleen Spiegel
Posted by
Dr. Colleen Spiegel
Dr. Colleen Spiegel is a mathematical modeling and technical writing consultant (President of SEMSCIO) and Professor holding a Ph.D. and an MSc degree in Engineering. She has seventeen years of experience in engineering, statistics, data science, research & technical writing work for many companies as a consultant, employee, and independent business owner. She is the author of ‘Designing and Building Fuel Cells’ (McGraw-Hill, 2007) and ‘PEM Fuel Cell Modeling and Simulation Using MATLAB’ (Elsevier Science, 2008). She previously owned Clean Fuel Cell Energy, LLC, which was a fuel cell organization that served scientists, engineers, and professors world-wide.


Enter the code in the box below: