The performance of a fuel cell stack can be estimated using a few equations combined with some input data. A common way of characterizing performance of different fuel cell stacks is using polarization curves. Although you cannot pinpoint specific issues with these curves, they will allow you to calculate the overall performance. An example polarization curve is shown in Figure 1.
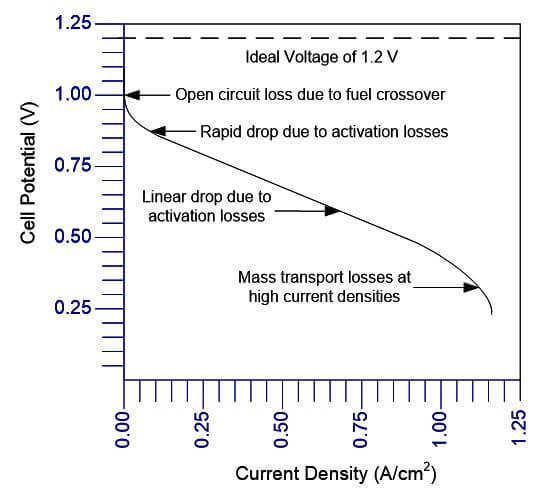
Figure 1. Example of a PEMFC polarization curve.
There are three distinct regions of a fuel cell polarization curve:
• At low power densities, the cell potential drops due to activation polarization.
• At moderate current densities, the cell potential decreases linearly with current due to ohmic losses.
• At high current densities, the cell potential drop departs from the linear relationship with current density due to concentration polarization (mass transport losses).
Step 1: Calculate the Nernst Voltage
The first step in creating the polarization curve is to calculate the Nernst voltage. The common form of the Nernst equation is:
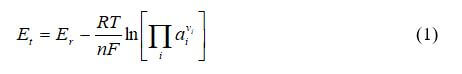
where R is the ideal gas constant, T is the temperature, ai is the activity of species i, vi is the stoichiometric coefficient of species i, and Er is the standard-state reversible voltage, which is a function of temperature and pressure.
At standard temperature and pressure, the theoretical potential of a hydrogen–air fuel cell can be calculated as follows:
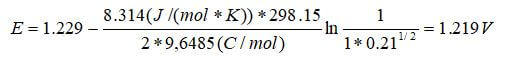
The potential between the oxygen cathode where the reduction occurs and the hydrogen anode at which the oxidation occurs will be 1.229 V at standard conditions with no current flowing. When a load connects the two electrodes, the current will flow as long as there is hydrogen and oxygen gas to react. The pressure dependence is nullified because both the anode and cathode are at 1 atm for our simple example. Further, the activity of the water is set to the relative humidity at the reaction site, which is unity because the water is being created at the cathode catalyst layer and does not limit the reaction in any way.
By assuming the gases are ideal (the activities of the gases are equal to their partial pressures, and the activity of the water phase is equal to unity), Equation 1 can be written as:
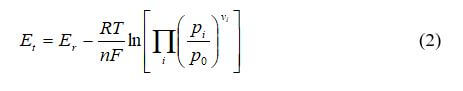
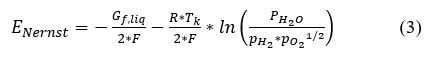
where pi is the partial pressure of species i, and p0 is the reference pressure. For our example, Nernst voltage can be calculated using the following equation:
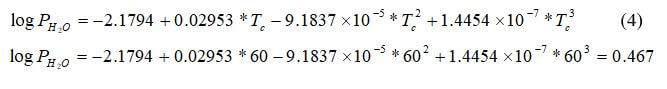
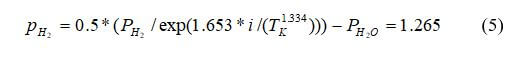
First, the partial pressures of water, hydrogen and oxygen will be calculated. First calculate the saturation pressure of water:
Calculate the partial pressure of hydrogen:
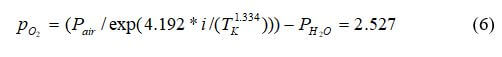
Calculate the partial pressure of oxygen:
The other constants needed for the Nernst equation are the Gibbs function in liquid form, Gf liq= -228,170 J/mol, Faraday's constant (Coulombs) = 96487, the Ideal gas constant (J/molK) = 8.314, and the temperature in degrees K.
Step 2: Calculate the Activation Losses
Activation losses is the voltage required to overcome the activation energy of the electrochemical reaction on the catalytic surface. This type of polarization dominates losses at low current density and measures the catalyst effectiveness at a certain temperature. The catalyst reduces the height of the activation barrier, but a loss in voltage remains due to the slow oxygen reaction. The total activation polarization overpotential is 0.1 to 0.2 V, which reduces the maximum potential to less than 1.0 V even under open-circuit conditions. Activation overpotential expressions can be derived from the Butler-Volmer equation. The activation overpotential increases with current density and can be expressed as:
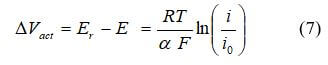
where i is the current density, and i0, is the reaction exchange current density. Exchange current density represents the reaction rate. The activation losses can be expressed as the Tafel equation:
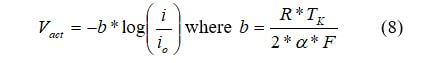
For our example, we will use the transfer coefficient, α, is 0.5, the exchange current density, i0, is 10-6.912 A/cm2, Faraday's constant (Coulombs) F = 96487, the Ideal gas constant (J/molK) R = 8.314, and the temperature in degrees K.
Step 3: Calculate the Ohmic Losses
Conductive materials have an intrinsic resistance to charge flow, which results in a loss in cell voltage called “ohmic polarization”. The cell components that contribute to the electrical resistance are the electrolyte, the catalyst layer, the gas diffusion layer, bipolar plates, interface contacts and terminal connections. The reduction in voltage is dominated by internal ohmic losses through the fuel cell. This voltage loss is called “ohmic loss,” and includes the electronic (Relec) and ionic (Rionic) contributions to fuel cell resistance. This can be written as:
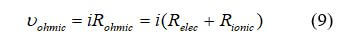
Rionic dominates the reaction in equation 9 since ionic transport is more difficult than electronic charge transport. Rionic is the ionic resistance of the electrolyte, and Relec includes the electrical resistance of bipolar plates, cell interconnects, contacts, and other cell components through which electrons flow. In our example, we will use with the internal resistance, R, is 0.19 Ωcm2.
Step 4: Calculate the Concentration Losses
A fuel cell must continuously be supplied with fuel and oxidant to produce electricity, and products must be continuously removed for maximum fuel cell efficiency. The study of mass transfer of uncharged species is important because it can lead to significant fuel cell performance losses. The reactant and product concentrations within the catalyst layer determine the fuel cell performance. Concentration loss can be minimized by optimizing the mass transport in the fuel cell electrodes and flow structures.
The mass transport in the fuel cell electrodes/fuel structures is dominated by convection and the laws of fluid dynamics since the flow channels are macroscale (usually in millimeters or centimeters). The mass transport of the fuel cell electrodes occurs on a microscale and are dominated by diffusion. A standard way of calculating fuel cell concentration loss (or mass transport loss), may be expressed by the equation:
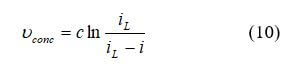
where c is a constant and can have the approximate form:
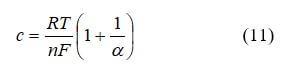
Actual fuel cell behavior frequently has a larger value than what the equation predicts. Due to this, c is often obtained empirically. The concentration loss appears at high current density and is severe. Significant concentration loss limits fuel cell performance. In our example, we will use the following form:
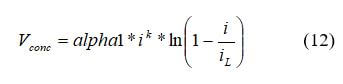
where the limiting current density, iL, is 1.4 A/cm2, the amplification constant (α1) is 0.085, the constant for mass transport, k, is 1.1. To insure there are no negative values calculated for Vconc, the mass transport losses will only be calculated if  , else Vconc = 0.
Step 5: Putting the Model Together
A single fuel cell provides a voltage dependent on operating conditions such as temperature, applied load, and fuel/oxidant flow rates. The cell voltage drops due to several irreversible loss mechanisms (activation, ohmic, and concentration losses). The loss is defined as the change in the cell potential (Virrev) from the theoretical potential (Vrev):
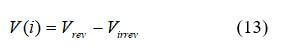
Therefore, the operating voltage of the cell can be represented as the departure from ideal voltage caused by these polarizations:
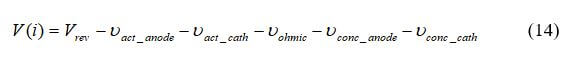
where Vact, Vohmic, Vconc represent activation, ohmic (resistive), and mass concentration polarization. As seen in equation 2, activation and concentration polarization occur at both the anode and cathode, while the resistive polarization represents ohmic losses throughout the fuel cell. The relationship between the fuel cell potential and current density (fuel cell polarization curve) can be expressed as:
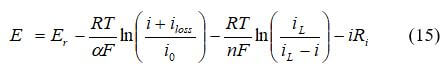
By plugging in the numbers into each of the equations, we obtain the following graph as the result of our example:
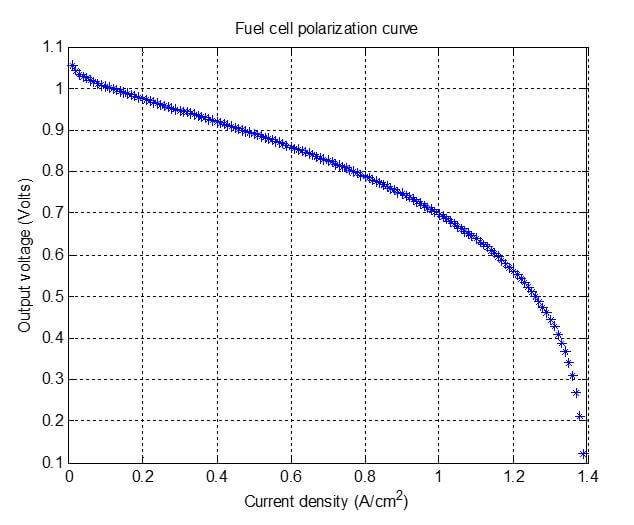
Figure 2. Polarization curve generated for our example.
Figure 2 shows the polarization curve generated from the equations use in the post’s example. This polarization curve will not exactly match the actual polarization curve for this fuel cell stack – but it is a good start. The model may need to be improved with more accurate ways of accounting for the phenomena that is occurring in the fuel cell.
This post showed how a fuel cell model can be constructed using electrochemistry concepts. The catalyst activation barrier must be overcome to convert products into reactants. To lower this activation barrier, a portion of the voltage is lost called activation overvoltage. The actual fuel cell voltage is also affected by the fuel cell charge and mass transport limitations. Changes in mass and charge transport can be noted by observing changes in the polarization curve.
 Posted by
Dr. Colleen Spiegel
Posted by
Dr. Colleen Spiegel
Dr. Colleen Spiegel is a mathematical modeling and technical writing consultant (President of SEMSCIO) and Professor holding a Ph.D. and an MSc degree in Engineering. She has seventeen years of experience in engineering, statistics, data science, research & technical writing work for many companies as a consultant, employee, and independent business owner. She is the author of ‘Designing and Building Fuel Cells’ (McGraw-Hill, 2007) and ‘PEM Fuel Cell Modeling and Simulation Using MATLAB’ (Elsevier Science, 2008). She previously owned Clean Fuel Cell Energy, LLC, which was a fuel cell organization that served scientists, engineers, and professors world-wide.